| Definition | Yersinia pestis CO92 chromosome, complete genome. |
|---|---|
| Accession | NC_003143 |
| Length | 4,653,728 |
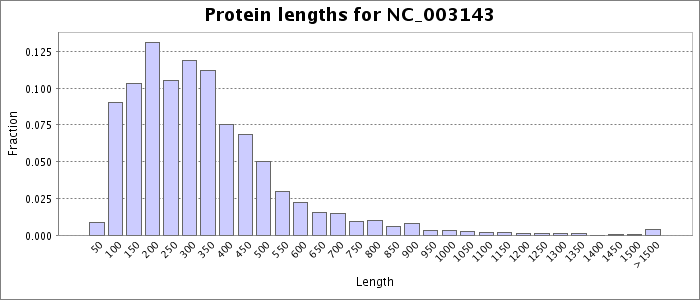
Protein length values were extracted from the faa file obtained for this accession number from NCBI. Each bar represents the fraction of the total protein sequences that have a length less than or equal to the given value, except for the last bar, which represents the fraction of the total sequences that are longer than the given length.
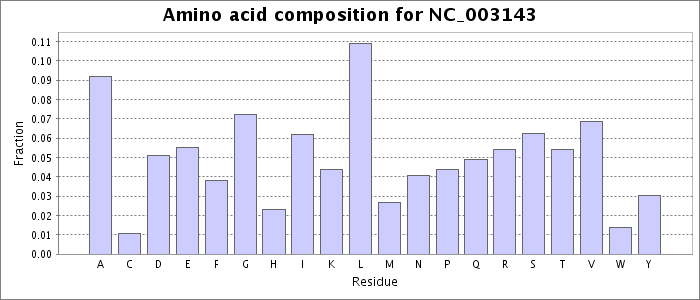
Amino acid composition values were extracted from the faa file obtained for this accession from NCBI. Each bar represents the fraction of the total amino acids matching the given residue.
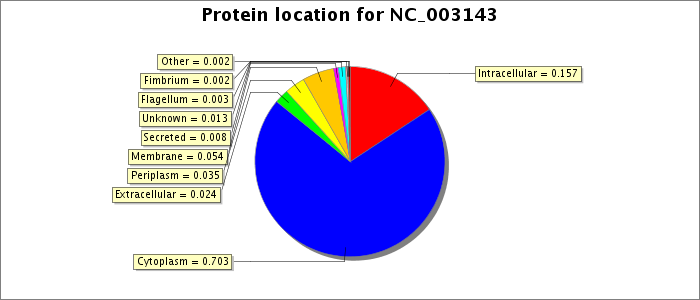
See the BacMap help page for a description of how subcellular locations were predicted.
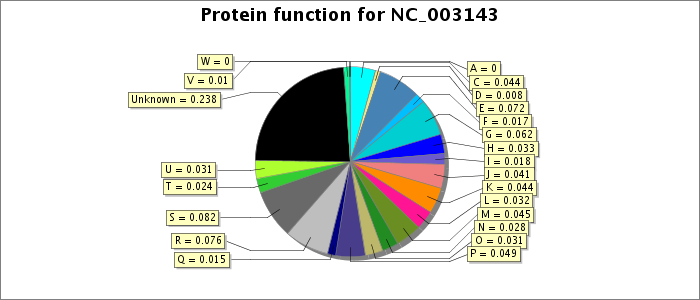
Letters refer to COG functional categories. C - Energy production and conversion; D - Cell division and chromosome partitioning; E - Amino acid transport and metabolism; F - Nucleotide transport and metabolism; G - Carbohydrate transport and metabolism; H - Coenzyme metabolism; I - Lipid metabolism; J - Translation, ribosomal structure and biogenesis; K - Transcription; L - DNA replication, recombination and repair; M - Cell envelope biogenesis, outer membrane; O - Posttranslational modification, protein turnover, chaperones; P - Inorganic ion transport and metabolism; R - General function prediction only; S - COG of unknown function. See the BacMap help page for a description of how proteins were classified into COG categories.
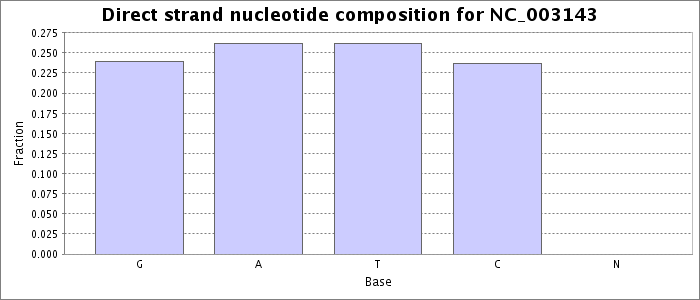
Nucleotide composition values were extracted from the fna file obtained for this accession from NCBI. Each bar represents the fraction of the total bases on the direct strand matching the given base.
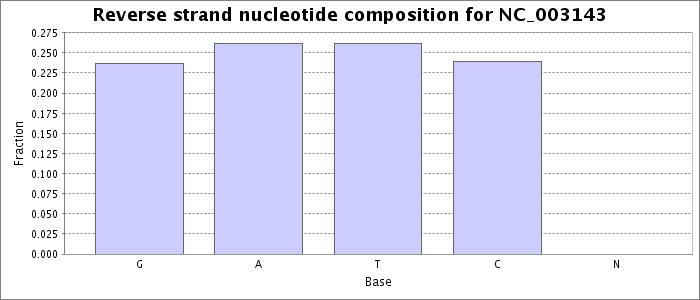
Nucleotide composition values were extracted from the fna file obtained for this accession from NCBI. Each bar represents the fraction of the total bases on the reverse strand matching the given base.
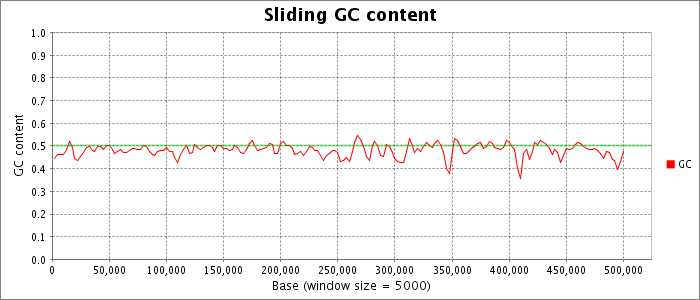
Nucleotide composition values were extracted from the fna file obtained for this accession from NCBI. The GC content and AT content are plotted as a fraction of the total bases in a sliding window.
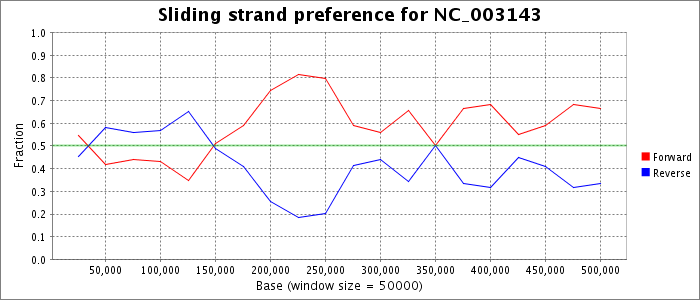
Gene positions (protein and functional RNA) were extracted from the GenBank record obtained for this accession from NCBI. The number of genes on the forward and reverse strands is plotted as a fraction of the total genes in a sliding window.